
Implementing Responsible Research Assessment in Practice: A Case Study of an Integrated Bibliometric Analysis System
© Author(s), 2026.
Licensed under CC-BY-NC-ND 4.0.
Abstract
This study presents the design and an exploratory pilot evaluation of ORAP (Open Research Analysis Platform), a web-based system for data-driven university research management. Unlike SciVal and InCites, which report metrics separately, ORAP integrates multiple bibliometric indicators into a single, transparently decomposable composite score.
ORAP provides a hierarchical weighted composite score, Citation Gap analysis, a Four-Quadrant Strategic Matrix, and publication-level drilldown. Analyzing institutional SciVal exports, it complements rather than replaces the underlying subscription. Seven users at a Korean national university evaluated it using an instrument adapted from the DeLone and McLean model; results are exploratory.
The study reveals that the overall mean was 4.40 out of 5.0, with usefulness highest (M = 4.71) and use experience lowest (M = 3.57).
The study shows how responsible-assessment principles can be operationalized in a working tool combining composite scoring, adjustable weighting, and publication-level transparency, offering a lower-cost complement to commercial platforms.
Keywords:
Bibliometrics, Research Evaluation, Research Performance Analysis, Decision Support System, Information Systems Evaluation, Academic Libraries1. Introduction
1.1 Background
Research performance evaluation has become a central component of university governance worldwide. Institutions increasingly rely on quantitative indicators to inform strategic decisions such as resource allocation, faculty promotion, and research investment prioritization (Hicks et al., 2015). In this context, commercial bibliometric platforms such as Elsevier’s SciVal and Clarivate’s InCites have been widely adopted. These platforms provide access to large-scale publication data along with standardized metrics, including FWCI (Field-Weighted Citation Impact), the h-index, and journal impact indicators.
However, from an institutional perspective, commercial systems present several limitations. First, they typically display individual metrics separately, requiring users to manually synthesize multiple indicators when comparing researchers or research fields (Waltman & van Eck, 2012). Second, limited transparency in metric calculation algorithms makes it difficult for evaluators to verify scores or respond to inquiries regarding researcher rankings. Third, annual licensing costs can amount to tens of thousands of dollars, posing a significant financial burden, particularly for institutions with limited budgets or those in developing countries.
At the same time, there is growing demand for responsible approaches to research evaluation. Initiatives such as DORA (2012) and the Leiden Manifesto (Hicks et al., 2015) have emphasized the risks of overreliance on single metrics and recommended multidimensional assessment that recognizes the diversity of research contributions. Despite these principles, practical tools that operationalize responsible research assessment in real-world institutional contexts remain limited.
1.2 Research Gap
Although prior research has extensively examined bibliometric indicators and their appropriate use, relatively few studies have focused on developing integrated systems that combine multiple metrics into decision-ready tools for research management. Commercial platforms primarily emphasize data provision, leaving the interpretation and synthesis of indicators to individual users. This poses particular challenges for research managers who may lack specialized bibliometric expertise but are nonetheless responsible for making funding and strategic decisions.
Moreover, empirical research on user acceptance and practical usability of bibliometric analysis systems within real institutional settings remains limited. Much of the literature concentrates on the theoretical validity of metrics, while comparatively less attention has been given to their implementation within decision-making workflows (Todeschini & Baccini, 2016). Understanding how users perceive and interact with such systems is essential for designing tools that effectively support research management in practice.
1.3 Purpose of the Study
This study aims to address the limitations of existing commercial research performance analysis tools by developing and evaluating ORAP Open Research Analysis Platform, a web based system designed to support university research management. While commercial platforms typically provide bibliometric indicators separately, requiring users to interpret and synthesize them independently, ORAP focuses on implementing an integrated analytical framework that supports strategic decision making.
First, ORAP introduces a Composite Scoring System. This system integrates key bibliometric indicators including FWCI Field Weighted Citation Impact, the proportion of top 10 percent cited publications, the proportion of publications in top tier journals, and international collaboration metrics into a single composite score on a 90 point scale using a hierarchical weighted algorithm. By synthesizing multiple metrics under a consistent evaluative framework, the system enables more intuitive and efficient comparison of research performance across individuals.
Second, ORAP incorporates a Citation Gap Analysis feature. This indicator quantifies the difference between actual citation counts and field expected citation levels. Beyond measuring past performance, it aims to identify researchers with growth potential or those who may require strategic support. Through this mechanism, research managers can systematically identify candidates for targeted intervention or investment.
Third, the system applies a Four Quadrant Strategic Matrix. Using average FWCI as a qualitative dimension and publication volume as a quantitative dimension, research fields are automatically classified into four categories Core Strength, Growth Potential, Scale Advantage, and Development Needed. This matrix enables structured diagnosis of the institutional research portfolio and supports strategic decisions regarding investment and development priorities.
Fourth, ORAP provides Drilldown Verification, allowing users to access individual publication level data underlying each composite indicator. This feature enhances transparency in score calculation and enables evidence based responses to inquiries regarding rankings or evaluation outcomes. Consequently, it strengthens both system credibility and explainability.
In addition, this study reports the results of a pilot evaluation conducted at Jeonbuk National University in South Korea. User acceptance was assessed using the DeLone and McLean (2003) Information Systems Success Model as a theoretical framework, focusing on dimensions such as usefulness, usability, information quality, use experience, and intention to use. By integrating system design characteristics with empirical user perceptions, this study seeks to identify the conditions under which bibliometric research performance analysis tools can be effectively implemented in academic libraries and university research support environments.
It should be emphasized that this study is positioned as an implementation case study and an exploratory pilot rather than a claim of generalizable, confirmatory research. Several of ORAP's components build on established constructs: the composite score is closely related to field-normalized citation-gap reasoning, and the Four-Quadrant Matrix adapts the logic of strategic portfolio matrices used widely outside bibliometrics. The distinctive contribution is therefore primarily one of design and integration, combining these elements with adjustable institutional weighting and publication-level drilldown verification in a single, transparent, and openly deployable system. The empirical evaluation is correspondingly modest in scope, and its findings are interpreted as preliminary evidence rather than confirmatory results.
1.4 Research Questions
This study addresses the following research questions:
- RQ1 How can multiple bibliometric indicators be integrated into a composite scoring system that supports transparent and responsible research evaluation?
- RQ2 How do users perceive the usefulness, usability, and information quality of the developed system?
- RQ3 What implications does the system have for academic libraries and research support services seeking alternatives to commercial bibliometric platforms?
1.5 Structure of the Paper
The remainder of this paper is organized as follows. Section 2 reviews the literature on bibliometrics, research evaluation systems, and information systems evaluation models. Section 3 describes the system architecture and core functionalities of ORAP. Section 4 presents the methodology of the pilot user evaluation. Section 5 reports the quantitative and qualitative findings. Section 6 discusses practical and research implications, as well as limitations and future research directions. Section 7 concludes the study.
2. Literature Review
2.1 Bibliometric Indicators for Research Evaluation
Bibliometrics refers to the quantitative analysis of scholarly publications and has become a foundational component of research evaluation in contemporary academia (Mingers & Leydesdorff 2015). Among numerous indicators, citation based metrics have been particularly widely adopted due to their perceived objectivity and computational simplicity.
The h index proposed by Hirsch (2005) combines research productivity and citation impact into a single value. A scholar has an h index of h if h of their publications have each received at least h citations. Despite its simplicity and widespread use, the h index has been criticized for disadvantaging early career researchers, failing to account for disciplinary differences in citation practices, and being insensitive to highly cited publications beyond the h core (Waltman & van Eck 2012).
To address disciplinary variation in citation behavior, Elsevier developed the Field Weighted Citation Impact FWCI. FWCI normalizes citations by comparing the actual citation count of a publication to the world average expected citation count for publications of the same type, year, and field. An FWCI value of 1.0 represents the global average, while values above 1.0 indicate above average citation impact (Elsevier 2023). Although field normalization is generally recognized as a fairer approach for cross disciplinary comparison, ongoing debates remain regarding the granularity and accuracy of field classification systems.
Additional indicators have been developed to capture specific dimensions of research performance. Percentile based metrics such as the proportion of publications in the top 10 percent of cited papers measure excellence rather than average performance. International collaboration indicators reflect the global reach of research activity. Journal level metrics such as CiteScore and Source Normalized Impact per Paper provide contextual information about publication venues (Waltman et al. 2013).
More recent work has continued to refine and critically assess these indicators and the data sources underlying them. Waltman (2016) provides a comprehensive review of citation-impact indicators and their normalization, while large-scale comparisons of bibliographic data sources have documented substantial differences in coverage and, consequently, in the accessibility and cost of institutional analytics (Visser, van Eck, & Waltman, 2021). These developments underscore both the maturity of the indicator toolkit and the continuing dependence of institutional analysis on a small number of proprietary data infrastructures.
A distinct but directly relevant body of work concerns the construction of composite indicators, which aggregate multiple sub-indicators into a single index. Methodological guidance in this area stresses that weighting and aggregation choices embed value judgments and should be accompanied by transparency and by uncertainty and sensitivity analysis (Nardo et al., 2008; Saisana, Saltelli, & Tarantola, 2005). This literature is particularly pertinent to systems such as ORAP, because reducing multidimensional research performance to a single score stands in explicit tension with the Leiden Manifesto's caution against over-reliance on composite measures (Hicks et al., 2015). The present study addresses this tension not by avoiding aggregation but by making the aggregation transparent, adjustable, and fully decomposable to the underlying publications.
2.2 Responsible Research Assessment
Growing concerns regarding the misuse of metrics have led to increasing calls for responsible research assessment. The San Francisco Declaration on Research Assessment DORA (2012) urged institutions to avoid using journal based metrics as surrogate measures of research quality and to consider the value of all research outputs. The Leiden Manifesto Hicks et al. 2015 proposed ten principles for responsible metric use, including supporting qualitative evaluation with quantitative data, protecting research diversity, and ensuring transparency in metric calculation.
These principles have influenced policy discussions and institutional evaluation practices worldwide. Established in 2022, the Coalition for Advancing Research Assessment CoARA has expanded to include more than 600 institutions committed to reforming research assessment (CoARA 2022). However, translating these principles into practical tools and operational workflows remains challenging. Many institutions continue to rely on commercial platforms primarily designed for data provision rather than for supporting responsible evaluation practices.
Recent research highlights the importance of indicator literacy among research managers and evaluators (Rafols et al. 2020). Understanding what metrics measure, their limitations, and the contexts in which they are appropriate is essential for responsible adoption. Tools that enhance transparency in calculation methods and enable verification of results can contribute to improving such literacy.
2.3 Commercial Bibliometric Platforms
The institutional bibliometric analysis market is currently dominated by a small number of commercial platforms. Elsevier SciVal, based on Scopus data, provides research performance analysis, institutional benchmarking, and collaboration network visualization. Clarivate InCites, built on Web of Science data, offers normalized indicators such as Category Normalized Citation Impact and journal percentile rankings, along with comparable analytical and reporting functions. These platforms reduce technical burdens for institutional users through intuitive dashboards, advanced visualizations, and automated reporting capabilities.
Nevertheless, the literature has consistently identified structural limitations of these commercial systems. First, there is the issue of metric isolation. Because multiple bibliometric indicators are presented separately, users must integrate their meanings and relationships independently (Gadd 2020). This can create interpretive inconsistencies and communication challenges, particularly for stakeholders without specialized bibliometric expertise.
Second, limited transparency remains a concern. Although platforms provide general explanations of calculation principles, access to detailed computation processes at the level of individual researchers or publications is typically restricted. This black box characteristic may weaken trust in evaluation outcomes and complicate evidence based responses to inquiries or appeals (Wouters et al., 2015).
Third, cost barriers present significant challenges. Annual licensing fees for comprehensive data access and analytical functionality can be substantial, posing financial constraints for smaller institutions or those with limited resources, and reinforcing existing inequalities in evaluative capacity between well-resourced and peripheral institutions (Rafols et al., 2016; Visser et al., 2021).
Fourth, standardization constraints may limit contextual adaptability. Commercial platforms offer generalized analytical frameworks and indicator systems, but these standardized structures may not always align with institutional strategic goals, evaluation criteria, disciplinary profiles, or policy priorities (Gadd, 2020; Wilsdon et al., 2015). As a result, there may be limitations in conducting institution-specific customized analysis and strategic planning.
2.4 Decision Support Systems for Research Management
Decision Support Systems DSS originated in the field of management science and refer to computer based systems that support decision making activities through data analysis, modeling, and information presentation (Power 2002). In the context of research management, DSS can assist in identifying research strengths, allocating resources, and formulating strategic plans.
An effective research management DSS should integrate multiple data sources, provide analytical capabilities for identifying patterns, include visualization tools for communicating results, and allow flexibility to reflect institutional context (Abramo & D’Angelo 2014). In addition, user centered design is essential to ensure that the system aligns with the practical needs and workflows of research managers.
Despite increasing interest in evidence-based research management, relatively few studies have documented the development and evaluation of dedicated decision support systems for this purpose. Much of the applied evaluative-informetrics literature focuses on producing indicators rather than on embedding them within institutional decision workflows (Moed, 2017), and many reported systems address specific functions such as collaboration-network analysis or research-trend identification, while comprehensive and integrative approaches to performance-evaluation systems remain limited (Araújo et al., 2024).
2.5 Information Systems Evaluation
Evaluation of information systems should extend beyond verifying technical functionality and consider how actual users perceive and accept the system. One of the most influential theoretical frameworks providing such an integrated perspective is the Information Systems Success Model originally proposed by DeLone and McLean in 1992 and updated a decade later (DeLone & McLean, 2003). The revised model offers a comprehensive analytical framework for assessing system effectiveness across multiple dimensions (DeLone & McLean, 2003).
The updated model conceptualizes system success through six interrelated dimensions. First, system quality refers to technical characteristics such as reliability, usability, and response time. Second, information quality evaluates the outputs produced by the system, including accuracy, relevance, and timeliness. Third, service quality encompasses the level of support, maintenance, and responsiveness provided by the system operator. Fourth, use and intention to use capture both actual usage behavior and the intention to continue using the system. Fifth, user satisfaction reflects the overall subjective evaluation of the system experience. Finally, net benefits represent the positive or negative impacts at the individual, organizational, and societal levels. This multidimensional structure enables simultaneous analysis of technical attributes and cognitive and organizational effects, and it has been widely applied in the evaluation of digital libraries, discovery systems, and research information management tools within academic library and information science research (Kim & Abbas 2010; Lwoga 2013).
In addition, the Technology Acceptance Model proposed by Davis (1989) provides a complementary perspective by focusing on determinants of user adoption. According to this model, perceived usefulness, defined as the degree to which a person believes that using a system enhances job performance, and perceived ease of use, defined as the degree to which a person believes that using a system requires minimal effort, are key predictors of intention to use. These constructs have demonstrated strong predictive validity across various technological and organizational contexts and offer an important theoretical foundation for understanding system adoption and diffusion.
3. System Design and Implementation
3.1 Design Principles
The design of ORAP was guided by four core principles derived from the literature on responsible research assessment and user centered design. These principles reflect a design orientation that seeks to ensure validity, transparency, and practical applicability beyond mere functional implementation.
The first principle is integration over isolation. Unlike commercial platforms that present multiple metrics separately, ORAP was designed to integrate diverse bibliometric indicators into a composite metric, enabling holistic evaluation of research performance. At the same time, access to individual component metrics and underlying data is maintained to allow detailed examination and contextual interpretation.
The second principle is transparency and verifiability. All score calculation processes are designed to be traceable to the level of individual publications. Users can directly examine the basis for specific scores and verify results when necessary. This structure enhances trust in the evaluation process and strengthens accountability in metric use.
The third principle is strategic actionability. ORAP is not limited to describing current performance but provides classification frameworks and interpretive tools that support decision making and resource allocation. Strategic categorization of research fields and identification of researchers requiring support are intended to translate analytical results into policy and managerial actions.
The fourth principle is institutional customization. Research evaluation criteria vary according to institutional size, disciplinary structure, and strategic objectives. ORAP therefore allows adjustment of weighting schemes and key analytical parameters, enabling application that reflects institutional context and priorities.
Together, these four principles provide the theoretical and practical foundation for positioning ORAP not merely as a bibliometric analysis tool but as a responsible and context sensitive decision support system for research management.
3.2 System Architecture
ORAP is implemented as a web based application using the following technology stack:
Backend Python 3.x with Flask
Database SQLite
Frontend HTML5 CSS3 using Bootstrap 5 and JavaScript
Visualization Chart.js for interactive charts
The system architecture follows a three tier model consisting of presentation, application, and data layers. This separation enables independent modification of user interface components, analytical algorithms, and data structures.
Data are imported from institutional SciVal export files and include publication level information such as author, affiliation, citation counts, FWCI, journal classification, and collaboration type. The current implementation includes 24,543 publications from Jeonbuk National University covering the period from 2015 to 2025.
3.3 Composite Scoring Algorithm
A central innovation of ORAP is its hierarchical weighted scoring system, which integrates multiple bibliometric indicators into a single composite score on a 90 point scale. The algorithm was designed to reduce the interpretive burden associated with fragmented metrics and to facilitate intuitive comparison across researchers while preserving transparency and institutional customization. The scoring structure consists of two layers: core indicators and supplementary indicators. Core indicators account for 80 points and primarily capture qualitative research impact and performance strength. Average FWCI, representing field normalized citation impact, is allocated 20 points. The number of top 10 percent cited publications, reflecting high impact productivity, contributes 20 points. The proportion of publications in top tier journals is assigned 20 points. International collaboration FWCI, measuring the citation impact of internationally coauthored research, is also weighted at 20 points.
Supplementary indicators account for 10 points and reflect broader dimensions of research responsibility and visibility. Research aligned with the United Nations Sustainable Development Goals is allocated 3 points. The proportion of open access publications receives 3 points. Topic prominence percentile, indicating engagement in highly visible research clusters, contributes 4 points.
Each indicator is normalized according to its percentile rank within the institutional distribution and proportionally mapped to its allocated score range. For example, a researcher positioned at the 75th percentile for average FWCI receives 15 points for that component, calculated as 75 percent of the maximum 20 points. This percentile based normalization reflects relative standing within the institution while maintaining cross indicator comparability.
Figure 1 presents the Excellent Researcher Ranking interface in ORAP. The interface displays the composite score alongside its decomposition into core and supplementary components, enabling users to view both the overall ranking and the contribution of each scoring layer. This structure ensures that integration does not obscure underlying performance dimensions.
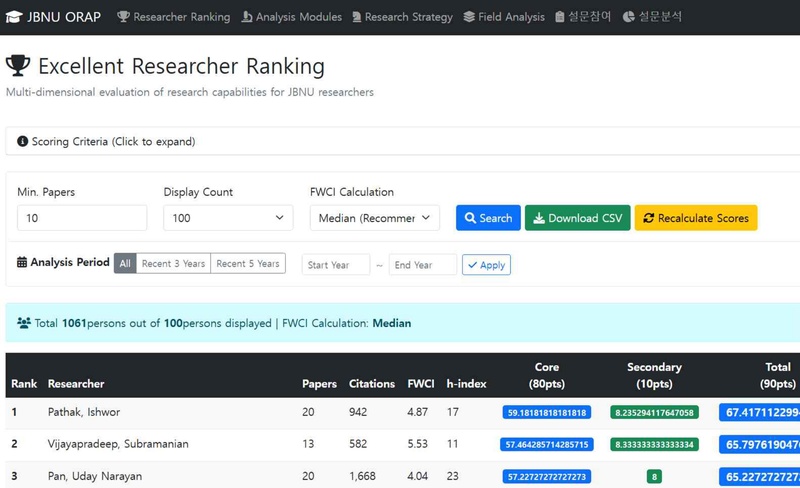
Researcher Ranking Interface in ORAP Displaying Composite Score and Hierarchical Score Decomposition
To address skewness in citation distributions and the influence of extreme outliers, the system allows users to select between mean FWCI and median FWCI for score calculation. Because citation distributions are typically highly skewed, mean FWCI may be disproportionately affected by a small number of highly cited publications. Median FWCI provides a more robust estimate of central tendency and is particularly useful for evaluating researchers with heterogeneous citation profiles. This flexibility enhances methodological transparency and supports responsible research assessment practices.
The point allocations used in the composite score (20/20/20/20 for the four core indicators and 3/3/4 for the supplementary indicators) represent a deliberately transparent equal-weighting baseline rather than empirically optimized weights. In the absence of institution-specific preference elicitation, equal weighting is a defensible and widely used default in composite-indicator construction (Nardo et al., 2008). Because any fixed weighting scheme embeds value judgments that stand in tension with the Leiden Manifesto's caution against reducing multidimensional performance to a single number (Hicks et al., 2015), ORAP mitigates this concern in three complementary ways: the weights are user-adjustable to reflect institutional priorities, every composite score is fully decomposable to the individual-publication level through drilldown verification, and users may substitute median for mean FWCI to reduce the influence of outliers. A formal uncertainty and sensitivity analysis of how rankings shift under alternative weighting schemes (Saisana et al., 2005) was beyond the scope of this pilot and is identified as a priority for future work.
By combining integration, transparency, and robustness, the hierarchical composite scoring system transforms multidimensional bibliometric data into actionable decision support while preserving interpretability and institutional adaptability.
3.4 Citation Gap Analysis
Citation Gap is a novel indicator introduced in ORAP to assess the extent to which a researcher’s citation performance deviates from field-level expectations. Unlike conventional citation-based indicators that primarily measure accumulated impact, Citation Gap evaluates relative underperformance or overperformance against normalized expectations derived from FWCI. The Citation Gap is calculated as follows:
The expected citation count is derived from FWCI and is computed by summing the field-expected citations for all publications of a given researcher:
Because FWCI represents the ratio of actual citations to field-expected citations, dividing each publication’s citation count by its FWCI yields the expected citation value for that publication. Aggregating these values across all publications produces the total expected citation count.
Figure 2 illustrates the implementation of Citation Gap analysis within ORAP. The interface identifies researchers who publish in high-ranking journals but receive lower-than-expected citation impact relative to field norms. The system displays actual citations, expected citations, and the resulting Citation Gap, allowing users to quickly identify performance discrepancies.
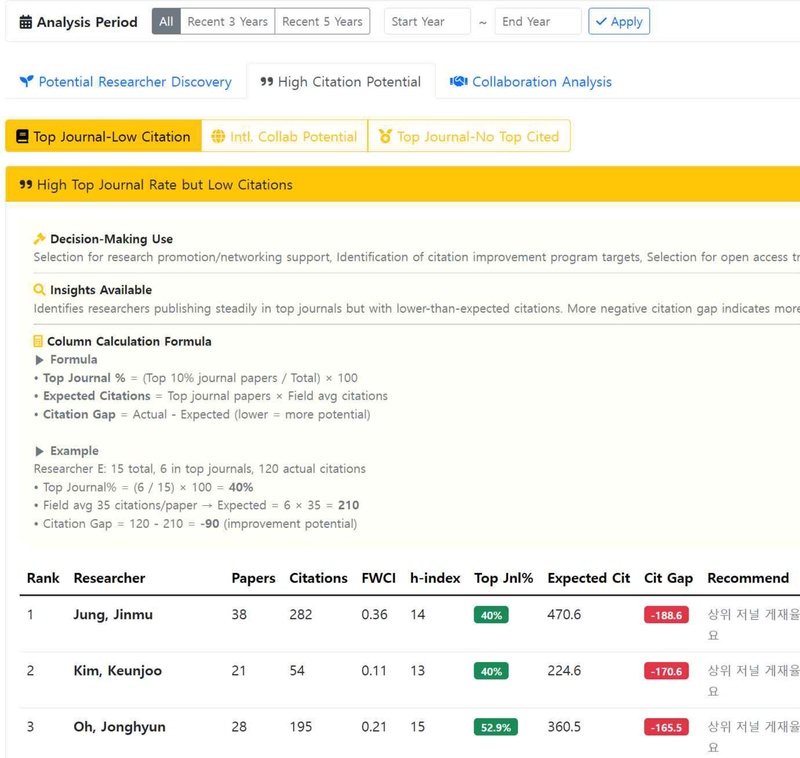
Citation Gap Analysis Interface in ORAP Identifying Researchers with High Top-journal Publication Rates but Lower-than-expected Citation Impact
In the example shown in Figure 2, researchers with a high proportion of publications in top journals are identified despite exhibiting substantially negative Citation Gap values. A large negative gap indicates that actual citations fall significantly below expected levels, suggesting potential for performance improvement. Such researchers may benefit from targeted institutional support measures, including visibility enhancement, strategic collaboration facilitation, dissemination training, or open access promotion.
Conversely, a large positive Citation Gap indicates citation performance exceeding field expectations, reflecting strong research influence relative to disciplinary norms.
Importantly, Citation Gap shifts the evaluative focus from absolute citation counts to developmental potential. Rather than functioning solely as a retrospective performance metric, it serves as a diagnostic tool for strategic intervention. This aligns with the principles of responsible research assessment by emphasizing support and capacity building rather than punitive ranking.
Through this approach, ORAP extends bibliometric analysis beyond descriptive reporting and toward actionable research management decision support.
3.5 Four Quadrant Strategic Matrix
To support strategic planning at the research field level, ORAP applies a Four Quadrant Strategic Matrix based on two key dimensions: quality and scale. This framework moves beyond descriptive bibliometric reporting and provides a structured decision support mechanism for differentiated strategy formulation across research fields.
The first dimension, quality, is operationalized as the average Field Weighted Citation Impact FWCI of publications within a given field. Because FWCI normalizes citation performance relative to global field specific expectations, it enables fair cross disciplinary comparison and reflects qualitative research impact.
The second dimension, scale, is measured by the total number of publications produced within the field during the selected analysis period. This dimension captures research volume and institutional production capacity.
Each dimension is dichotomized into high and low categories based on the institutional median value. The intersection of these two dimensions produces four strategic field types.
Fields with high quality and high scale are classified as Core Strength. These areas represent institutional research pillars and require continued investment, reinforcement, and international positioning.
Fields with high quality but low scale are categorized as Growth Potential. These areas demonstrate strong impact but limited volume and may benefit from selective investment, recruitment, and strategic expansion.
Fields with high scale but relatively low quality are labeled Scale Advantage. These areas show strong productivity but weaker normalized impact and may require quality enhancement initiatives, such as targeted collaboration or research capacity development.
Fields with both low quality and low scale are classified as Development Needed. These areas may require strategic reassessment, structural reform, or selective consolidation.
Figure 3 presents the Field Analysis interface in ORAP, where selected ASJC based fields are compared across multiple indicators including average FWCI, international collaboration rate, top journal percentage, industry collaboration, and strategic classification. The system automatically assigns a strategy grade based on the quadrant position, enabling rapid portfolio level diagnosis.
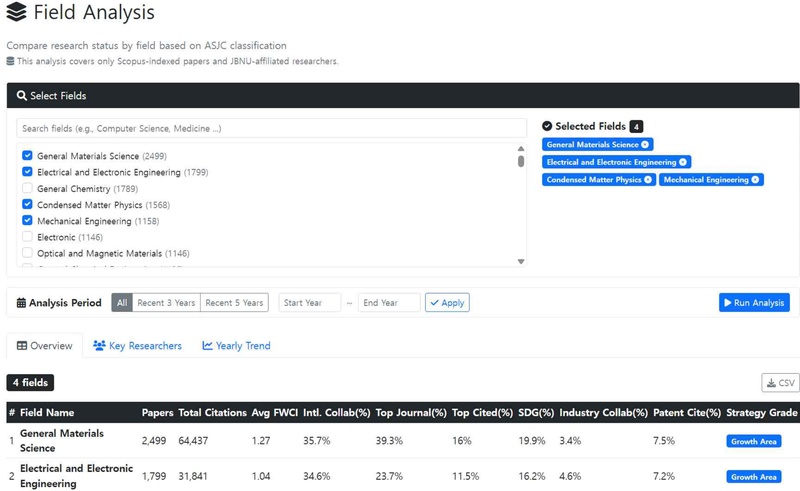
Field Level Analysis Interface in ORAP Showing Multi-indicator Comparison and Strategic Classification.
By integrating normalized impact and production scale into a single analytical framework, the Four Quadrant Strategic Matrix enables institutional leaders to identify differentiated intervention strategies rather than applying uniform evaluation criteria across all fields. This approach aligns with responsible research assessment principles by recognizing disciplinary diversity while simultaneously supporting actionable institutional decision making.
Through this structured portfolio perspective, ORAP extends bibliometric field analysis from static reporting toward dynamic strategic management.
3.6 Drilldown Verification
All indicators provided in ORAP are directly linked to the underlying list of publications contributing to each score. By selecting a specific indicator, users can access detailed information at the individual publication level. This feature ensures that composite scores are not presented as opaque aggregates but can be examined in terms of their underlying components.
The detailed view includes publication title and author information, journal name and publication year, citation count, and FWCI value. In addition, the system displays information about how each publication contributes to specific indicators, such as flags indicating whether the publication belongs to the top 10 percent of cited papers. This allows users to clearly understand which components of the composite score each publication influences.
This transparency function enhances verifiability of score calculation and supports evidence based communication with evaluated researchers. It also enables deeper analysis of individual performance patterns while considering qualitative context alongside quantitative metrics.
3.7 Additional Features
ORAP integrates multiple functional modules to address diverse analytical needs in research management.
First, the researcher ranking function generates rankings based on the composite score. Users can filter results by analysis period, department, or academic field, enabling context specific comparison and evaluation. This feature can support various managerial decisions, including personnel evaluation and identification of candidates for strategic support.
Second, the analysis module provides advanced diagnostic tools. The Citation Gap identification function analyzes the difference between expected and actual citation levels to identify researchers who may require support. Growth trend analysis enables examination of changes in research performance over time based on time series data. International collaboration pattern analysis explores characteristics of coauthorship networks and collaboration structures.
Third, the field comparison function allows side by side comparison of multiple academic fields across all indicators. This supports comprehensive diagnosis of the institutional research portfolio. Analytical results can be exported in CSV format for further analysis or report preparation.
Fourth, multilingual support enhances accessibility by providing both Korean and English interfaces. This feature broadens usability not only for domestic users but also in international collaboration contexts.
4. Methodology
4.1 Research Design
This study employed a single case evaluation design to assess user perceptions following the pilot implementation of ORAP at Jeonbuk National University. A mixed methods approach combining quantitative survey data and qualitative feedback was adopted to comprehensively examine system acceptance and identify areas for improvement.
4.2 Study Setting and Participants
Jeonbuk National University is a national research intensive university in South Korea with approximately 20000 students and 1500 faculty members. ORAP was deployed in February 2026 for pilot testing and made accessible to research support staff and selected faculty members.
Participants were recruited through convenience sampling among users who accessed the system during the pilot period. A total of seven respondents completed the survey, consisting of five faculty members, one research support staff member, and one other user. This sample is small and drawn from a single institution; accordingly, it is not intended to support inferential or generalizable claims but to provide preliminary, exploratory evidence on how early-stage users perceive the system. This exploratory status is reflected consistently in the framing of the results, discussion, and conclusions.
4.3 Instrument Development
The survey instrument was developed by adapting the DeLone and McLean (2003) Information Systems Success Model to the context of research performance analysis. While grounded in the original model, the items were reformulated to reflect tasks directly related to research management in order to enhance content validity.
The survey employed a five point Likert scale, where one indicated strong disagreement and five indicated strong agreement. It consisted of eighteen closed ended items measuring five dimensions.
Usefulness was measured with four items assessing whether the system improves work efficiency, supports decision making, contributes to strategic planning, and enhances contextual understanding of research performance.
Usability was measured with five items covering ease of understanding, intuitive navigation, ease of information retrieval, natural integration with workflow, and adequacy of support functions.
Information quality was measured with five items evaluating reliability of results, relevance to evaluation purposes, clarity of meaning, adequacy of supporting evidence, and data timeliness.
Use experience was measured with two items assessing whether the system was applied in actual work and whether it influenced decision making processes.
Intention to use was measured with two items evaluating willingness to continue using the system and willingness to recommend it to others.
In addition, five open ended questions were included to collect qualitative feedback regarding system strengths, challenges encountered during use, suggestions for enhancing trust, requests for additional features, and other comments. These qualitative responses were used to complement quantitative findings.
4.4 Data Collection Procedure
The online survey was conducted in February 2026 using the built in survey module within ORAP. Participants accessed the survey after using key system features such as researcher ranking, analysis modules, research strategy tools, and field analysis. Email addresses were collected solely to prevent duplicate responses, and participation was voluntary.
4.5 Data Analysis
Quantitative data were analyzed using descriptive statistics, including means and frequency distributions. Given the small sample size (N = 7), no inferential statistical analysis was conducted, and internal-consistency reliability coefficients (e.g., Cronbach's alpha) were not computed, as such estimates are unstable and potentially misleading at this sample size; all quantitative results are therefore reported as exploratory findings requiring validation with larger samples. A further limitation is that the same seven respondents provided both the quantitative ratings and the open-ended comments, so the qualitative data corroborate rather than independently triangulate the survey results. Formal psychometric validation of the adapted 18-item instrument is left to future, larger-sample work.
Qualitative responses were analyzed using thematic content analysis. Recurrent themes were coded to identify strengths, weaknesses, and improvement suggestions. Representative quotations illustrating key themes were selected.
4.6 Ethical Considerations
Participation was voluntary, and informed consent was obtained through a consent procedure at the beginning of the survey. Email addresses were used only to prevent duplicate responses and were not linked to individual survey answers during analysis. The study was conducted in accordance with institutional guidelines for research involving human participants.
5. Results
5.1 Overall Evaluation
The overall mean score across the eighteen items was 4.40 out of 5.0, indicating generally positive user perceptions of ORAP. All dimension level means exceeded 3.5, suggesting acceptable performance across all evaluated aspects of the system.
5.2 Dimension Level Results
Mean scores by dimension were as follows. Usefulness 4.71, usability 4.46, intention to use 4.43, information quality 4.40, and use experience 3.57.
Usefulness received the highest rating, indicating that users perceived ORAP as making a substantial contribution to work efficiency and decision support. This reflects user recognition of the system effectiveness in translating research performance data into actionable insights.
Usability was also rated highly at 4.46, suggesting positive perceptions of interface clarity and intuitive interaction. Information quality at 4.40 indicates general satisfaction with the reliability, supporting evidence, and timeliness of the provided data.
Intention to use scored 4.43, demonstrating strong willingness to continue using the system and to recommend it to others. This suggests positive perceptions of long term value and diffusion potential.
In contrast, use experience received the lowest mean score of 3.57. Considering that the evaluation was conducted during the early pilot stage, this result likely reflects limited integration of the system into formal workflows rather than intrinsic system deficiencies. As institutional adoption stabilizes, actual usage experience may increase accordingly.
5.3 Item Level Results
Table 1 presents the mean scores for individual survey items.

Item Level Evaluation Results(N = 7)
The item level mean scores provide a multidimensional understanding of user perceptions of ORAP. Overall, most items received scores above 4.0, indicating generally positive evaluations across system attributes.
Within the usefulness dimension, all four items recorded identical mean scores of 4.71, the highest across all dimensions. The items measuring improvement in work efficiency, support for decision making, contribution to strategic planning, and enhancement of contextual understanding were consistently rated highly, suggesting that ORAP provides substantial practical value in research management tasks. This uniformity should, however, be interpreted with caution: with only seven respondents, identical dimension-level means are also consistent with a ceiling or halo effect and with the limited statistical resolution of a very small sample, rather than necessarily indicating genuinely equal perceptions across the four sub-constructs.
In the usability dimension, ease of understanding, intuitive use, and ease of information retrieval each received a mean score of 4.57. This indicates that the interface structure and navigation are generally clear and accessible. In contrast, natural workflow integration and adequacy of help functions received slightly lower scores of 4.29. Although still positive, these comparatively lower ratings suggest room for improvement in aligning the system more closely with existing work processes and in strengthening user guidance mechanisms.
Within the information quality dimension, clarity of data timeliness received the highest score of 4.71, while adequacy of supporting evidence was rated at 4.57. These findings demonstrate strong user confidence in the currency of the data and the transparency of supporting information. Reliability of results and ease of understanding meaning were both rated at 4.29, maintaining a positive evaluation. However, relevance to specific evaluation purposes received a comparatively lower score of 4.14. This may indicate that the system does not fully align with certain specialized evaluation contexts or user specific needs.
The use experience dimension showed the lowest mean scores, with both actual work application and influence on decision making rated at 3.57. This likely reflects limited integration of the system into formal workflows during the pilot phase rather than inherent functional weaknesses. In other words, users recognize the system potential value, but actual usage frequency and experiential familiarity remain at an early stage.
Finally, within the intention to use dimension, both intention to continue using the system and intention to recommend it to others received mean scores of 4.43. Compared to the relatively lower use experience scores, this suggests strong future adoption potential and positive diffusion through recommendation.
Overall, ORAP demonstrates particular strengths in usefulness and information quality, with usability also evaluated positively. However, the comparatively lower score in use experience highlights the importance of deeper integration into organizational workflows, enhanced user training, and sustained implementation efforts to support long term adoption.
5.4 Qualitative Findings
Thematic content analysis of responses to the open-ended questions yielded three major categories: perceived strengths, challenges and improvement suggestions, and feature requests. The qualitative findings complement the quantitative results presented earlier by providing a more detailed understanding of user expectations and practical considerations within real-world usage contexts.
Respondents identified objective and standardized analysis as the most significant strength of ORAP. One participant noted that the system “applies diverse analytical tools and standardized formulas to construct a quantitative and objective performance analysis framework, enabling data-driven research policy planning and rational decision-making.” This indicates that the composite scoring algorithm and hierarchical weighting structure are perceived not merely as numerical outputs but as analytically meaningful tools with policy relevance.
Positive feedback was also given regarding information organization. A respondent stated that the system “effectively classifies desired information and enhances both the speed and rigor of the decision-making process.” This suggests that ORAP reduces cognitive burden by structuring large volumes of research performance data in a coherent manner, thereby improving analytical efficiency.
The intuitive interface was repeatedly mentioned as a strength. The comment that the system is “very intuitive and easy to use” aligns with the high usability scores reported in the quantitative analysis. This supports the effectiveness of the user-centered design principles applied during system development.
Finally, the researcher ranking function was highlighted as practically useful. The comment that “the ranking results of outstanding researchers are useful” suggests that the composite score-based comparison function can be directly applied to personnel evaluation, selection of research support recipients, and strategic planning tasks. Overall, the qualitative findings confirm that ORAP is positively perceived in terms of analytical capability, information presentation structure, and policy applicability.
Despite the generally positive evaluation, several areas for improvement were identified. The most detailed suggestion concerned enhancement of the researcher identification system. One respondent noted that “if English name matching systematically connects researcher information such as affiliation and position, it could be immediately utilized for research awards, funding allocation, performance management, and policy decision-making.” This highlights the need for integration between bibliometric data and internal institutional human resources and research management databases. For ORAP to function as a comprehensive decision support infrastructure, a higher level of data integration is required.
Requests for user interface improvements were also mentioned. Although overall usability was rated positively, some respondents indicated that further refinement of layout and visual design would enhance user experience. This suggests that even with strong usability performance, continuous interface improvement remains important.
Additionally, comments such as “it is difficult to understand the formulas” and “explanatory materials for score and ranking calculations are needed” emphasize the importance of interpretability and documentation. These concerns directly relate to discussions of transparency and indicator literacy in responsible research assessment literature. Even when technical drilldown verification is available, user-friendly documentation and educational support are necessary to establish practical trust and understanding.
Respondents proposed several additional features. With respect to indicator expansion, requests included integration of SJR-based analysis, Nature Index indicators, and enhanced internal researcher identification functions. These suggestions reflect a desire to broaden analytical scope by incorporating additional external evaluation frameworks.
One respondent proposed that “if quantitative analysis of contributions to world university rankings and institutional performance indicators were added, it would be possible to implement a full-cycle research support lifecycle from performance analysis to policy planning, research support, and feedback.” This indicates the potential for ORAP to evolve beyond an analytical tool into a comprehensive strategic management platform.
Finally, the suggestion that “a menu allowing users to request desired analytical views is needed” reflects demand for customized analytical environments. This underscores the importance of user-configurable dashboards tailored to institutional strategies and user roles.
Overall, the qualitative findings confirm ORAP’s strengths in objective analysis and practical applicability, while also highlighting future development directions including data integration, documentation enhancement, and user customization.
6. Discussion
6.1 Summary of Findings
This study presented ORAP, a web-based research performance analysis system incorporating composite scoring, Citation Gap analysis, strategic research field classification, and transparent verification functions. A pilot evaluation with seven users at Jeonbuk National University yielded an overall mean score of 4.40 out of 5.0. Usefulness received the highest rating at 4.71, while use experience recorded the lowest at 3.57.
6.2 Interpretation of Results
The highest score in usefulness indicates that ORAP’s core design principle—integrating multiple bibliometric indicators into a single composite score that provides actionable insights—effectively aligns with user needs. Notably, all four usefulness items received identical high ratings of 4.71, demonstrating consistent positive perceptions across improvement in work efficiency, decision support, strategic planning contribution, and contextual understanding. This supports the validity of the integrated interpretation approach over isolated metric presentation.
Usability at 4.46 and information quality at 4.40 were also rated highly. Particularly, high scores for data timeliness and adequacy of supporting evidence suggest that the system successfully provides transparent and evidence-based outputs.
The relatively lower score in use experience at 3.57 is likely attributable to the early pilot phase rather than structural system limitations. At the time of evaluation, ORAP had not yet been fully integrated into routine institutional workflows, limiting opportunities for repeated practical application.
Meanwhile, intention to use was rated at 4.43, indicating strong potential for sustained adoption and recommendation. This suggests that perceived value has already been established, and broader institutional integration may further increase actual usage.
Qualitative findings reinforce these interpretations. Positive evaluations of objective and standardized analysis support the policy relevance of the composite scoring approach. At the same time, requests for clearer documentation highlight the need for user-friendly explanations alongside technical transparency. Calls for integration with institutional HR and research databases suggest that the practical value of bibliometric systems increases significantly when embedded within broader organizational infrastructure.
Overall, ORAP demonstrates strong potential as an integrated and strategically actionable research management decision support system, particularly when combined with institutional integration and user education.
6.3 Limitations
Several limitations qualify the findings of this study. First, the evaluation is based on a small convenience sample of seven users at a single institution; it is therefore exploratory, and the results cannot be generalized. Consistent with this, no inferential statistics or internal-consistency reliability coefficients were computed. Second, the same respondents provided both the quantitative and qualitative data, so the two strands are mutually corroborating rather than independently triangulated. Third, the composite score relies on researcher-assigned equal weights that were not subjected to formal sensitivity analysis; although the weights are adjustable and every score is transparently decomposable, alternative weightings could produce different rankings. Fourth, and most important for the paper's cost argument, ORAP analyzes data exported from an institutional SciVal (Scopus) subscription. It therefore lowers the marginal effort of institutional analysis and adds transparency and customization, but it does not remove the need for the underlying commercial data source; it is best understood as a complementary analytical layer rather than a full replacement for commercial platforms. These limitations directly motivate the future work outlined below.
7. Conclusion
This study presented the design and an exploratory pilot evaluation of ORAP, an open research analysis platform developed to support data-driven decision-making in university research management. To address limitations of commercial bibliometric platforms, such as metric fragmentation, limited transparency, and lack of institutional customization, ORAP introduced a multi-indicator composite scoring system, automated strategic field classification, and drilldown verification at the individual-publication level. These features aim to enhance integration, actionability, and explainability, and their principal novelty lies in their transparent, adjustable integration rather than in the underlying indicators themselves.
The exploratory pilot with seven users yielded an overall mean score of 4.40, indicating generally positive but preliminary acceptance. Usefulness received the highest rating (4.71), suggesting that composite-score-based integrated analysis is perceived as contributing to work efficiency and decision support, while the lower use-experience score (3.57) is consistent with the early implementation stage. Because of the small, single-institution sample, these results should be read as indicative rather than confirmatory.
The findings suggest that institutions already licensing the underlying bibliometric data can develop customized, transparent analytical tools as a complementary, lower-cost alternative to the analytical layer of commercial platforms. The composite scoring algorithm, Citation Gap analysis, and Four-Quadrant Strategic Matrix offer practical frameworks for transforming research performance data into actionable strategic intelligence, provided their assumptions remain transparent to users.
Although limited by its small sample size, single-institution context, and dependence on an existing SciVal subscription, this study provides initial empirical evidence regarding the design principles and user acceptance of bibliometric decision support systems. Future research should include larger and multi-institutional samples, psychometric validation of the instrument, sensitivity analysis of the weighting scheme, and longitudinal analysis of adoption and organizational impact. As research assessment evolves toward more responsible and multidimensional approaches, integrated and explainable systems such as ORAP may contribute to operationalizing these principles within real institutional settings.
Statements and Declarations
Author Contributions: The author was responsible for all aspects of the study, including conceptualization, data collection, analysis, and manuscript preparation.
Funding: This paper was supported by research funds of Jeonbuk National University in 2025.
Data Availability Statement: The data presented in this study are available on reasonable request from the corresponding author.
Institutional Review Board Statement: Not applicable.
Informed Consent Statement: Informed consent was obtained from all participants involved in the study.
Conflicts of Interest: The authors declare no conflict of interest.
Generative AI Use Statement: Generative AI tools were used in the preparation of this manuscript. The authors used Claude Opus4 for language translation. The authors reviewed and edited all AI-generated content and take full responsibility for the accuracy, originality, and integrity of the final manuscript.
References
-
Abramo, G. & D’Angelo, C. A. (2014). How do you Define and Measure Research Productivity?, Scientometrics, 101, 1129–1144.
[https://doi.org/10.1007/s11192-014-1269-8]

-
Araújo, M. L. de Caldas, L. S., Barreto, B. S., Menezes, P. P. M., Silvério, J. C. dos S., Rodrigues, L. C., Serrano, A. L. M., Neumann, C. Mendes, N. (2024). How to Evaluate the Effectiveness of Performance Management Systems? An Overview of the Literature and a Proposed Integrative Model, Administrative Sciences , 14(6), 117. Handle: RePEc:gam:jadmsc:v:14:y:2024:i:6:p:117-:d:1407667
[https://doi.org/10.3390/admsci14060117]
- Coalition for Advancing Research Assessment (CoARA). (2022). Agreement on reforming research assessment . Coalition for Advancing Research Assessment. Available at: https://zenodo.org/records/13480728, (Accessed: 20 February 2026).
-
Davis, F. D. (1989). Perceived Usefulness, Perceived Ease of Use, and User Acceptance of Information Technology, MIS Quarterly, 13(3), 319–339.
[https://doi.org/10.2307/249008]
-
DeLone, W. H. & McLean, E. R. (2003). The DeLone and McLean Model of Information Systems Success: A Ten-year Update, Journal of Management Information Systems, 19(4), 9–30.
[https://doi.org/10.1080/07421222.2003.11045748]
- DORA. (2012). San Francisco Declaration on Research Assessment. https://sfdora.org/
- Elsevier. (2023). SciVal metrics guidebook. https://www.elsevier.com/solutions/scival
-
Gadd, E. (2020). University Rankings Need a Rethink, Nature, 587(7835), 523.
[https://doi.org/10.1038/d41586-020-03312-2]
-
Hicks, D., Wouters, P., Waltman, L., de Rijcke, S. & Rafols, I. (2015). ‘Bibliometrics: The Leiden Manifesto for Research Metrics’, Nature, 520(7548), 429–431.
[https://doi.org/10.1038/520429a]
-
Hirsch, J. E. (2005). An Index to Quantify an Individual’s Scientific Research Output, Proceedings of the National Academy of Sciences, 102(46), 16569–16572.
[https://doi.org/10.1073/pnas.0507655102]
-
Kim, Y. M. & Abbas, J. (2010). Adoption of library 2.0 functionalities by academic libraries and users: A knowledge management perspective, The Journal of Academic Librarianship, 36(3), 211–218.
[https://doi.org/10.1016/j.acalib.2010.03.003]
-
Lwoga, E. T. (2013). Measuring the Success of Library 2.0 Technologies in the African Context: The Suitability of the DeLone and McLean’s Model, Campus-Wide Information Systems, 30(4), 288–307.
[https://doi.org/10.1108/CWIS-02-2013-0011]
-
Mingers, J. & Leydesdorff, L. (2015). A Review of Theory and Practice in Scientometrics, European Journal of Operational Research, 246(1), 1–19.
[https://doi.org/10.48550/arXiv.1501.05462]
-
Moed, H. F. (2017). Applied evaluative informetrics. Cham: Springer.
[https://doi.org/10.1007/978-3-319-60522-7]
-
Nardo, M., Saisana, M., Saltelli, A., Tarantola, S., Hoffman, A., & Giovannini, E. (2008). Handbook on constructing composite indicators: Methodology and user guide. Paris: OECD Publishing.
[https://doi.org/10.1787/9789264043466-en]
- Power, D. J. (2002). Decision Support Systems: Concepts and Resources for Managers. Westport, CT: Quorum Books. https://www.researchgate.net/publication/324690241_Decision_Support_Systems_Concepts_and_Resources_for_Managers
-
Rafols, I. & Robinson-Garcia, Nicolás. (2016). On the Dominance of Quantitative Evaluation in Peripherall Countries: Auditing Research with Technologies of Distance. SSRN Electronic Journal.
[https://doi.org/10.2139/ssrn.2818335]
- Rousseau, R., Egghe, L., & Guns, R. (2018). Becoming metric-wise: A bibliometric guide for researchers. Cambridge, MA: Chandos Publishing.
-
Saisana, M., Saltelli, A., & Tarantola, S. (2005). Uncertainty and sensitivity analysis techniques as tools for the quality assessment of composite indicators. Journal of the Royal Statistical Society: Series A (Statistics in Society), 168(2), 307-323.
[https://doi.org/10.1111/j.1467-985X.2005.00350.x]
-
Todeschini, R. & Baccini, A. (2016) Handbook of Bibliometric Indicators: Quantitative Tools for Studying and Evaluating Research . Weinheim: Wiley-VCH.
[https://doi.org/10.1002/9783527681969]
-
Visser, M., van Eck, N. J., & Waltman, L. (2021). Large-scale comparison of bibliographic data sources: Scopus, Web of Science, Dimensions, Crossref, and Microsoft Academic. Quantitative Science Studies, 2(1), 20-41.
[https://doi.org/10.1162/qss_a_00112]
-
Waltman, L. (2016). A review of the literature on citation impact indicators. Journal of Informetrics, 10(2), 365-391.
[https://doi.org/10.1016/j.joi.2016.02.007]
-
Waltman, L. & van Eck, N. J. (2012) A New Methodology for Constructing a Publication-level Classification System of Science, Journal of the American Society for Information Science and Technology, 63(12), 2378–2392.
[https://doi.org/10.48550/arXiv.1203.0532]
-
Waltman, L., van Eck, N. J., van Leeuwen, T. N. & Visser, M. S. (2013) Some Modifications to the SNIP Journal Impact Indicator, Journal of Informetrics, 7(2), 272–285.
[https://doi.org/10.48550/arXiv.1209.0785]
-
Wilsdon, J., Allen, L., Belfiore, E., Campbell, P., Curry, S., Hill, S., Jones, R., Kain, R., Kerridge, S., Thelwall, M., Tinkler, J., Viney, I., Wouters, P., Hill, J., & Johnson, B. (2015). The metric tide: Report of the independent review of the role of metrics in research assessment and management. Bristol: HEFCE. https://www.ukri.org/wp-content/uploads/2021/12/RE-151221-TheMetricTideFullReport2015.pdf
[https://doi.org/10.4135/9781473978782]
-
Wouters, P., Thelwall, M., Kousha, K., Waltman, L., de Rijcke, S., Rushforth, A. & Franssen, T. (2015) The Metric Tide: Literature Review (Supplementary Report I to the Independent Review of the Role of Metrics in Research Assessment & Management). Bristol: HEFCE.
[https://doi.org/10.13140/RG.2.1.5066.3520]
Suntae Kim is a Professor in the Department of Library and Information Science and Director of the Research Data Convergence Research Institute at Jeonbuk National University, Republic of Korea. Working as a meta-scientist, Kim conducts research in scientometrics and in research data infrastructure, with particular attention to research data repositories, research data certification, and FAIR data requirements. Recent work addresses the AI Ready Data ecosystem and pursues empirically grounded research by building working systems through vibe coding, so that findings can be applied directly in practice.