
When Referral Data Mislead: The Statistical Invisibility of a Walled-Garden Search Market in Korea
© Author(s), 2026.
Licensed under CC-BY-NC-ND 4.0.
Abstract
Global market-share statistics built from web referrals are a standard input to research on platform competition. This paper shows that, for a walled-garden incumbent, such statistics misrepresent the market in a structured way. We assemble a 138-month panel (January 2015 to June 2026) that pairs StatCounter referral shares with a Korean behavioural panel (Internet Trend) for the same search market. The two sources identify a different market leader in 127 of 138 months: the referral metric records Google ahead, while the behavioural panel records the domestic incumbent Naver ahead by a wide margin. Averaged over the panel, the referral metric understates Naver by 36 percentage points and overstates Google by a comparable amount. The direction of the error is consistent with each engine’s architecture: engines that retain users inside their own content ecosystem are understated, whereas engines that route users to the open web are overstated. A platform decomposition over 2009 to 2026 places the distortion on the desktop, where Naver is understated by about 43 points throughout, and shows that an apparent narrowing of the gap after 2024 originates inside the referral series and is absent from the behavioural panel. The enclosure that suppresses the incumbent’s outbound referrals is also what the competition literature identifies as the source of its durability, which suggests that statistical invisibility and market persistence in this case may share a common cause.
Keywords:
Search Engines, Market-Share Measurement, Referral Data, Network Effects, First-Mover Advantage, Naver1. Introduction
Search is one of the most concentrated markets in the digital economy, and only a small set of national markets departs from Google’s global position. South Korea is the clearest case among high-income economies. The domestic portal Naver has led national search since the early 2000s, after it combined web results with a set of in-house services and a user-contributed knowledge base (Kim and Tse, 2012). Studies of these markets, and the industry analyses that inform competition policy, draw heavily on global usage statistics. StatCounter Global Stats is the most widely cited free source of such statistics; it reports the share of search engines from referral events recorded across a large network of tracked websites and is commonly read as an approximation of search usage.
For most markets the referral approximation is adequate, because the engines being compared route users outward to the open web in similar proportions. A walled-garden incumbent breaks this symmetry. When an engine answers a query with its own blogs, community posts, shopping listings, and encyclopaedic entries, the session frequently terminates inside the engine’s own domain and generates no outward referral to a tracked third-party site. The referral metric therefore observes the incumbent mainly when it sends users away, which is what an enclosed engine is designed not to do. The result is a measurement gap whose size depends on how thoroughly an engine encloses its users.
Empirical work on platform competition routinely treats referral-based shares as a measure of market share, yet for a market with an enclosed incumbent that equivalence has not been tested against an independent behavioural source. This paper asks how far the two measurements diverge in such a market, and whether the divergence follows a pattern. We pair the referral metric with a behavioural panel that records query activity within Korea and compare the two over a common 138-month window. The two sources disagree on the identity of the market leader in 92 percent of months. The disagreement is not noise: across engines, the sign of the error is consistent with each engine’s click-routing architecture, and a platform decomposition shows that the distortion is concentrated on the desktop and is stable across more than a decade.
The paper makes three contributions. First, it quantifies, over a long panel, the divergence between a referral metric and a behavioural panel in a market where a domestic incumbent leads, and shows that the divergence is large enough to invert the market ranking. Second, it shows that the divergence is systematic rather than random: engines are misstated in a direction and magnitude consistent with whether they retain or release users. Third, it offers an interpretation that links the measurement result to the economics of the market: the ecosystem enclosure that suppresses the incumbent’s measured referrals is the same feature that the competition literature identifies as sustaining its position, so that durability and statistical invisibility may be two expressions of one cause. This interpretation is exploratory; the evidence comes from a single market and four engines.
2. Theoretical background
2.1. First-mover advantage and lock-in
A first mover in a market with strong demand-side increasing returns can acquire an advantage that persists well beyond its initial lead. Network externalities make a product more valuable as its installed base grows (Katz and Shapiro, 1985), and small early advantages can become self-reinforcing and lock a market onto a particular provider (Arthur, 1989). The strategic literature treats such advantages as contingent rather than automatic, depending on switching costs, the durability of early scale, and the incumbent’s ability to renew its lead (Lieberman and Montgomery, 1988; Katz and Shapiro, 1994). Switching costs and network effects can jointly hold customers to an incumbent even when a rival offers a stronger product (Farrell and Klemperer, 2007; Shapiro and Varian, 1999), and on a multi-sided platform an incumbent can entrench its position through the services it coordinates around the core product (Eisenmann, Parker, and Van Alstyne, 2006). Digital platforms, in which adoption and content accumulation feed one another, are a natural setting for these mechanisms (Rochet and Tirole, 2003). First-mover advantage of this kind has also been documented in Korean digital markets in adjacent settings (Bae and Jung, 2024).
2.2. Domestic search incumbents and ecosystem enclosure
Search engines compete on the quality of their index and on the content they place in front of users (Gandal, 2001; Lianos and Motchenkova, 2013). Network externalities operate in search as well, since a larger user base generates more behavioural data that improves results and draws further users (Argenton and Prüfer, 2012), and language can segment these effects, so that a domestic engine accumulates an advantage within its own linguistic market that global engines do not contest on equal terms (Jeon, Jullien, and Klimenko, 2021). More recent work formalises how data-driven indirect network effects can entrench a search incumbent (Prüfer and Schottmüller, 2021). A domestic incumbent that cannot match a global engine on raw index quality can still defend its position by supplying content that the global engine does not hold. Naver did this through a knowledge-sharing service and a set of in-house verticals whose contents are not fully accessible to outside crawlers. Kim and Tse (2012, 2014) model this configuration—an inferior engine that adds a knowledge-sharing service against a superior engine without one—and show that the inferior engine is advised to keep its answer database closed in order to maximise market share. Closure is not incidental to the incumbent’s strategy; it is the strategy. The same closure carries a measurement implication that the competition literature has not examined: an engine that keeps its answers inside its own domain produces few of the outward referrals on which a global usage tracker depends.
2.3. Measuring usage through referrals
A referral-based statistic counts, for each tracked page view, the engine that sent the visitor, and aggregates these counts into shares. This construct measures an engine’s outward referral footprint, which is a valid proxy for usage only when the engines being compared release users to the open web in similar proportions. For an enclosed incumbent the proxy and the underlying quantity diverge, because much of the incumbent’s usage never leaves its own domain. A behavioural panel, which records activity from a sample of users rather than from a sample of destination sites, does not share this dependence on outward referrals and provides an independent measurement against which the referral metric can be assessed. The two are different constructs, and the question is not which is correct in general but where, and by how much, they diverge.
The distinction between what a web metric records and what it is taken to measure has a longer history in audience research. Studies of digital audiences have shown that measures built from the technical structure of the web, such as hyperlinks, produce a different map of attention from measures built from observed use, and that the two can diverge sharply along national and linguistic lines (Taneja, 2017; Webster and Ksiazek, 2012). Work on web-traffic concentration likewise treats the choice of measurement source as a substantive decision rather than a technicality (Hindman, 2018), and reviews of the search-engine market note that published share figures depend on the method by which they are collected (Lewandowski, 2023). The present study applies this concern to a specific and consequential case: a referral-based share statistic applied to an enclosed incumbent.
Three expectations follow. The referral metric should understate an enclosed incumbent relative to a behavioural panel. Across engines, the direction of the error should follow click-routing architecture, with enclosed engines understated and open-web engines overstated. And because enclosure operates most strongly where the incumbent’s in-house content is richest, the error should be concentrated rather than uniform across usage contexts. These expectations are examined descriptively; the design compares two measurements and does not test a causal mechanism.
3. Data
The analysis uses two monthly series for the Korean search market. The first is StatCounter Global Stats, which reports engine shares from referral events across its network of tracked sites; we use the all-platform series and, separately, the desktop and mobile series, each running from January 2009 to June 2026. The second is Internet Trend, a Korean behavioural panel operated by BizSpring that reports engine shares from query activity within Korea, available monthly from January 2015. The behavioural levels in the panel’s published summary are taken as the reference levels; the monthly behavioural series is reconstructed from the panel’s published charts by reading anchor points and interpolating between them (Appendix A); it is accurate to within about one to two percentage points at the anchor points and is used for trajectories, rank and correlation statistics, but not for the reported bias levels. The common window for the two-source comparison is January 2015 to June 2026 (138 months); the platform decomposition uses the full 210-month StatCounter window.
Table 1 reports descriptive statistics over the common window. The referral metric places Naver at 27.6 percent on average and Google at 65.3 percent, while the behavioural panel places Naver at 63.8 percent and Google at 28.1 percent. The two sets of means are close to a mirror image of one another, which is a first indication that the disagreement is not a matter of degree.

Descriptive Statistics for Korean Search Shares, by Source and Platform (Monthly, Percent).
4. Method
For engine j in month t with share sⱼₜ, the demand-side reading of shares used in the search-competition literature expresses the position of an engine relative to an outside option through the log ratio in equation (1), following the discrete-choice inversion of Berry (1994) and Berry, Levinsohn, and Pakes (1995), as applied to search by Gandal (2001).
| (1) |
Here s0t is the share of the outside option. The transformation is monotone in share and is used only to fix the interpretation of shares as the observable trace of underlying demand; the empirical analysis works directly with shares.
The object of interest is the divergence between the two measurements. For engine e, let SCe and ITe denote its mean share under the referral metric and the behavioural panel over the common window. The measurement bias is defined in equation (2); a positive value indicates overstatement by the referral metric and a negative value indicates understatement.
| (2) |
To summarise disagreement on the market leader, let rt denote the leading engine under each source in month t. The rank-disagreement rate is the share of months in which the two sources name different leaders, equation (3), where the indicator equals one when the leaders differ.
| (3) |
Two further questions are addressed. The first is whether the all-platform divergence reflects platform composition rather than within-platform measurement. Writing the all-platform share of an engine as the pageview-weighted average of its desktop and mobile shares, equation (4) with wd + wm, the divergence can be separated into a part attributable to how the two sources weight platforms and a part that survives any weighting (Oaxaca, 1973).
| (4) |
Because the weighted average cannot exceed the larger of the two platform shares, the quantity P – max(sd, sm), where P is the behavioural-panel level, is a lower bound on the within-platform component that no choice of weights can remove; it bounds the share of the gap that platform composition can explain. The second question is whether the 2024 movement in the referral series reflects the market or the metric, which is examined by comparing the largest month-on-month change in each source around the transition.
A regression-based identification strategy such as two-stage least squares is not appropriate here, because the analysis compares two measurements of the same quantity rather than estimating the causal effect of an endogenous regressor; there is no first-stage relationship to instrument. The divergence is therefore characterised by decomposition and by robustness checks, reported below and in Appendix A, rather than by instrumental-variables estimation.
To examine whether the bias is organised by architecture, each engine is assigned an enclosure score from its known design—enclosed for an engine that answers from its own content ecosystem, partially enclosed for a portal whose enclosure has eroded, and open for an engine that routes users to the open web. The classification is made from each engine’s architecture and is independent of the measured bias, so it serves as an external property against which the sign and size of the error can be compared. With only four engines observed, this comparison is read as illustrative evidence rather than as a fitted relationship.
5. Results
5.1. Rank inversion
Figure 1 plots the two sources over the common window. Under the referral metric Google leads for most of the period and the two domestic engines sit well below it; under the behavioural panel Naver leads throughout and Google is the distant second. The two pictures are not variations on a theme but opposite orderings. The referral metric records Google as the leading engine in 127 of 138 months; the behavioural panel records Naver as the leader in all 138. The rank-disagreement rate is therefore 92 percent (Table 2). The two series for Naver are almost uncorrelated across months (r = 0.26), so the referral metric does not merely shift the level of Naver’s share but fails to track its movement.
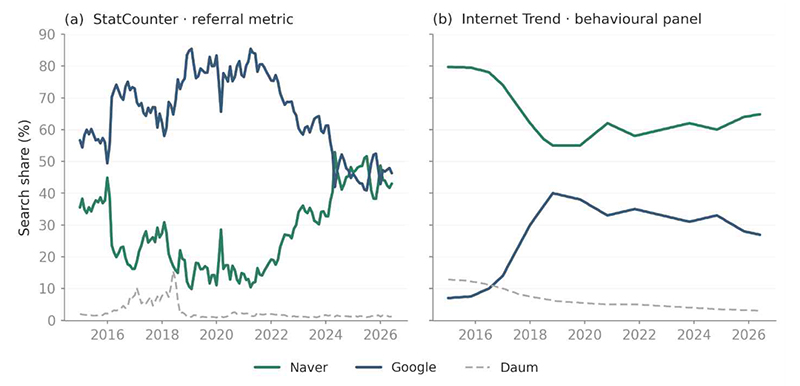
Korean Search Shares under Two Measurements, from January 2015 to June 2026.Notes: Lines show monthly shares for Naver, Google, and Daum. The two panels order the same market in opposite ways.
Divergence between the Referral Metric and the Behavioural Panel (138 Months).
5.2. The sign of the error
The disagreement has a consistent direction. Figure 2 plots each engine’s behavioural-panel level against its referral level. The domestic engines lie above the diagonal—understated by the referral metric—while the global engines lie below it. Naver is understated by 36 percentage points on average and Google is overstated by 37; the smaller domestic engine, Daum, is understated by a smaller margin, and Bing is mildly overstated. The error is not centred on zero with random scatter; its sign is consistent with the architecture classification.
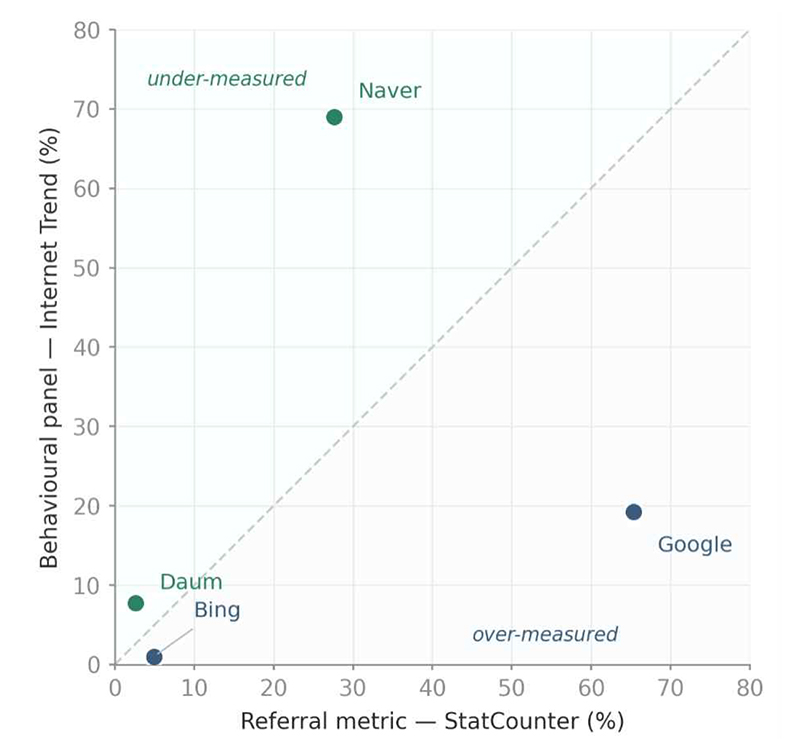
Behavioural-Panel Level against Referral-Metric Level, by Engine.Notes: Points above the 45-degree line are understated by the referral metric; points below it are overstated. Domestic engines lie above, global engines below.
5.3. Platform decomposition
A natural alternative explanation is that the referral metric weights the platform mix differently from the behavioural panel—for example, by over-weighting mobile, where Android defaults favour Google. The full platform series does not support this. Figure 3 decomposes the referral metric into desktop and mobile over 2009 to 2026, with the behavioural-panel level for Naver shown for reference. On the desktop the referral metric records Google ahead in 85 percent of all months and understates Naver by about 43 percentage points throughout, a gap that is stable from 2015 to 2026. On mobile the picture is not a clean mirror: the referral metric records Google ahead for most of the series, and the domestic incumbent overtakes only after early 2024. The desktop distortion, not the platform weighting, is the structural feature.
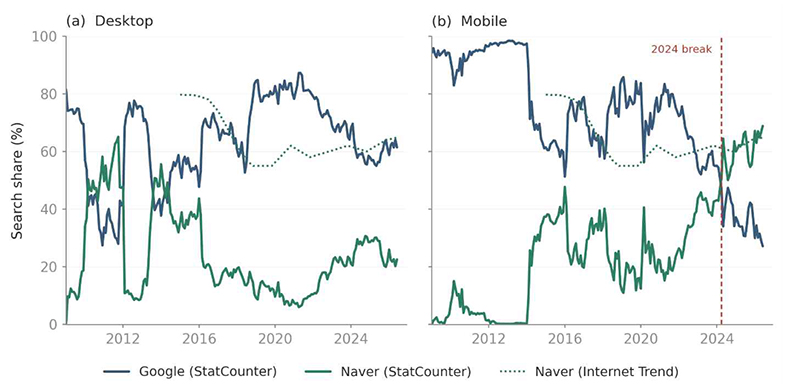
Referral-Metric Shares by Platform, from January 2009 to June 2026. (A) Desktop; (B) Mobile.Notes: Solid lines are the referral metric for Google and Naver; the dotted line is the behavioural-panel level for Naver. The vertical mark in (b) indicates the 2024 break internal to the referral series.
The bound makes this precise. Over the common window the behavioural panel places Naver at 63.8 percent, while the referral metric reaches at most 35.0 percent on either platform, so no pageview weighting can bring the referral metric within 28.8 points of the panel. That irreducible component is 80 percent of the 36.2-point all-platform gap; platform composition can account for at most one fifth of the divergence, and within-platform suppression for the remainder.
The mobile series also contains a discontinuity that bears on interpretation. Between late 2023 and mid-2024 the referral metric’s reading of Naver rises sharply in the mobile and all-platform series, with single-month changes of approximately 13 and 12 percentage points, respectively. The behavioural panel shows no corresponding movement over the same months; its reading of Naver is flat to within 0.4 percentage points. What is observed is that the referral series moves while the panel does not. Because a genuine shift in usage would be expected to appear in the behavioural panel as well, we interpret the 2024 movement as internal to the referral metric rather than as a change in the market, and the apparent recent convergence of the two sources as an artifact of the referral series.
5.4. Architecture
If the desktop understatement were merely a matter of fewer desktop users for the incumbent, every engine would be displaced in the same direction. Instead the sign of the error flips with architecture. Figure 4 and Table 3 report the desktop bias by engine alongside the enclosure classification assigned from each engine’s design. The enclosed incumbent is understated by 50 percentage points, the partially enclosed portal by 2, and the two open-web engines are overstated by 4 and 49. The sign of the bias matches enclosure for all four engines. The pattern is illustrative rather than a formal estimate, given that only four engines are observed; its weight rests on the consistency of the sign and on the contrast between the two domestic engines, which share a national user base but differ in enclosure. Naver, whose results page is dense with its own content, is understated by a factor of 3.6 relative to the panel; Daum, whose enclosure has eroded, by a factor of 1.5. The pattern is consistent with the enclosure mechanism rather than a test of it: the more an engine keeps users inside its domain, the more the referral metric loses sight of it.
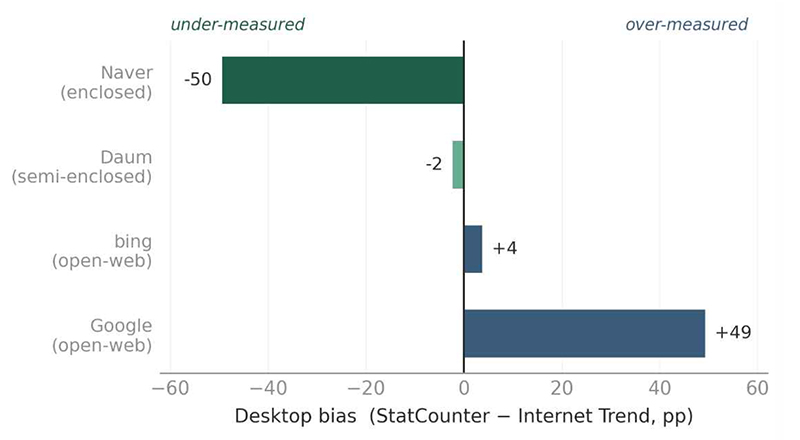
Desktop Measurement Bias by Engine and Click-Routing Architecture.Notes: Bars show the desktop bias (referral metric minus behavioural panel) over the common window. Enclosure is classified from each engine’s design, independently of the measured bias.
Desktop Bias and Enclosure by Engine.
6. Discussion
The results connect a measurement problem to a competitive one. What is observed is a large, stable divergence between two measurements of the same market whose direction is consistent with engine architecture. Our interpretation is as follows. An enclosed incumbent retains users inside its own ecosystem, and that retention has two simultaneous effects: it raises switching costs and supplies content the global entrant cannot match, which the competition literature identifies as sustaining the incumbent’s position; and it suppresses the outward referrals through which a global usage tracker observes the market, which renders the incumbent statistically faint. If both effects arise from the same property of the platform, then the market in which the incumbent is most durable is also the market in which a referral-based dataset is least able to see it. On this reading, measurement invisibility is a signature of competitive strength rather than a defect to be averaged away. The present evidence is consistent with this account but does not establish it causally; that would require measuring enclosure and referral suppression directly.
The direction of the divergence is what the enclosure mechanism predicts, and in that sense it is expected. One feature was not. Between late 2023 and mid-2024 the referral series for Naver rose by more than ten points within a single month while the behavioural panel did not move, an abrupt shift with no counterpart in the market. Its resolution is instructive: because the change appears in only one of the two sources, the more plausible reading is that it originates in that source’s method rather than in usage. The episode shows that even the reference measurement used to detect bias is itself subject to internal revision, and that a single source, however widely used, cannot be taken at face value over time.
Earlier work has read referral-based shares as market shares, and the broad fact that Naver leads Korean search while Google leads almost everywhere else is well established (Kim and Tse, 2012; Jeon, Jullien, and Klimenko, 2021). What has not been quantified is how far a global referral dataset departs from a behavioural one in this market. The present results put a figure on it and show that the departure is not a level offset but a reversal: the two sources order the market in opposite ways for the better part of a decade. The competition literature has treated Naver’s enclosure as a source of market power; the present evidence suggests that the same enclosure may also contribute to the market’s mismeasurement, a connection the prior work did not draw.
The mechanism need not be specific to Naver. If the pattern documented here holds elsewhere, an incumbent that answers queries from its own content ecosystem would be expected to be understated by a referral metric in proportion to how much of the session it retains, which would make domestic search incumbents elsewhere, and enclosed platforms more generally, candidates for the same distortion. This remains a hypothesis: the present evidence comes from a single market and four engines, and it cannot establish the generality of the relationship. A second, forward-looking conjecture runs in the opposite direction in time. As both domestic and global engines move toward answering queries directly on the results page, sessions may increasingly terminate without an outward referral for every engine, not only for walled gardens; if so, referral-based shares would become a weaker proxy for search usage across the board, and the gap documented here would be an early instance of a broader erosion.
This has a practical implication for empirical work. A large body of research on platform competition and on the geography of digital markets uses referral-based shares as a dependent or explanatory variable. Where the markets studied include enclosed incumbents, those shares are biased in a known direction, and the bias is largest exactly where the domestic platform is strongest. Conclusions about the competitiveness of such markets, or about the penetration of global platforms into them, may understate the domestic position unless the referral source is checked against a behavioural one. That check is feasible only where a second, independent measurement exists; Korea is unusual in providing one, which is why the analysis is confined to a single country.
Four practical rules follow for indicator selection and market analysis. First, in a market with an enclosed incumbent, referral-based shares should be treated as potentially downward-biased for enclosed incumbents and upward-biased for open-web rivals, rather than as direct point estimates of usage. Second, where a behavioural or query-log source exists, both measurements should be reported side by side, with the construct each one measures named explicitly; the present case shows that the choice of source can reverse the identity of the market leader, which is the quantity on which dominance assessments turn. Third, desktop referral shares are the most distorted component and should not be used on their own to characterise such a market. Fourth, a discontinuity in a single source should be checked against the second source before it is read as market change, as the 2024 episode illustrates. These rules are derived from one market and are offered as guidance to be tested rather than as general findings.
7. Limitations
Three limitations qualify the findings. The analysis covers one country, because the comparison requires a behavioural panel alongside the referral metric and few markets publish one; the single-country scope is thus a condition for the comparison rather than a convenience. The mechanism proposed turns on engine architecture rather than on anything specific to Korea and may apply wherever an enclosed incumbent competes with an open-web entrant, but the findings cannot be generalized beyond the Korean search market on the basis of this study alone; whether the same pattern appears elsewhere is an empirical question for future work. The behavioural series is reconstructed from published charts by anchor-point reading and linear interpolation and is accurate only to within about one to two percentage points at the anchors, so it supports the comparison of levels and trajectories reported here but not finer estimates; the reconstruction protocol, anchor data and code are provided in the public repository (Appendix A). And the architecture comparison rests on four engines, which fixes the sign of the relationship clearly but leaves its magnitude imprecise and does not support causal inference; the contrast between the two domestic engines carries most of the weight, and the comparison is illustrative throughout.
8. Conclusion
Global referral statistics misread a walled-garden search market in a specific way. In Korea they invert the market leader in 92 percent of months, understate the domestic incumbent by 36 percentage points, and do so through a desktop distortion that is stable across more than a decade and consistent with each engine’s click-routing architecture. The pattern is consistent with the distortion being the measurement counterpart of the enclosure that sustains the incumbent’s position, although the design does not identify this causally. For research that relies on such statistics, the implication is that markets with enclosed domestic incumbents require an independent behavioural check, and that the absence of one is likely to understate the domestic platform in precisely the markets where it is strongest. These conclusions are specific to the Korean market; extending the comparison to other markets with enclosed incumbents, wherever a second measurement can be obtained, is the natural direction for further work.
Statements and Declarations
Author Contributions: Conceptualization, S.S. and H.B.; methodology, H.B.; data collection, S.S.; analysis, H.B.; writing—original draft preparation, S.S. and H.B.; writing—review and editing, S.S. and H.B.; supervision, S.S.; project administration and correspondence, H.B. All authors have read and agreed to the published version of the manuscript.
Funding: This research received no external funding.
Data Availability Statement: The data can be accessed at: https://doi.org/10.5281/zenodo.22663428. The repository contains the digitized anchor-point data, the reconstructed monthly behavioural series, the reconstruction script, all StatCounter and Internet Trend inputs, and the complete analysis code that reproduces every table and figure. The original Internet Trend charts are available from BizSpring and are not redistributed in the repository.
Institutional Review Board Statement: Not applicable.
Informed Consent Statement: Not applicable.
Conflicts of Interest: The authors declare no conflicts of interest.
Generative AI Use Statement: Claude (Anthropic) was used only for English translation and language polishing. All AI-assisted text was reviewed and revised by the authors, who take full responsibility for the final manuscript.
References
-
Argenton, C., & Prüfer, J. (2012). Search engine competition with network externalities. Journal of Competition Law and Economics, 8(1), 73–105.
[https://doi.org/10.1093/joclec/nhr018]

-
Arthur, W. B. (1989). Competing technologies, increasing returns, and lock-in by historical events. The Economic Journal, 99(394), 116–131.
[https://doi.org/10.2307/2234208]
- Bae, H., & Jung, K. (2024). First-mover advantage in the used car-buying app market: Evidence from Korea. Journal of Industrial Innovation, 40(3), 73–81.
-
Berry, S. T. (1994). Estimating discrete-choice models of product differentiation. The RAND Journal of Economics, 25(2), 242–262.
[https://doi.org/10.2307/2555829]
-
Berry, S. T., Levinsohn, J., & Pakes, A. (1995). Automobile prices in market equilibrium. Econometrica, 63(4), 841–890.
[https://doi.org/10.2307/2171802]
- Eisenmann, T., Parker, G., & Van Alstyne, M. W. (2006). Strategies for two-sided markets. Harvard Business Review, 84(10), 92–101.
-
Farrell, J., & Klemperer, P. (2007). Coordination and lock-in: Competition with switching costs and network effects. In M. Armstrong & R. Porter (Eds.), Handbook of Industrial Organization (Vol. 3, pp. 1967–2072). Elsevier.
[https://doi.org/10.1016/S1573-448X(06)03031-7]
-
Gandal, N. (2001). The dynamics of competition in the Internet search engine market. International Journal of Industrial Organization, 19(7), 1103–1117.
[https://doi.org/10.1016/S0167-7187(01)00065-0]
-
Hindman, M. (2018). The Internet trap: How the digital economy builds monopolies and undermines democracy. Princeton University Press.
[https://doi.org/10.1515/9780691184074]
- Internet Trend. (2026). Search engine share: Korea [Data set]. BizSpring. https://www.internettrend.co.kr
-
Jeon, D.-S., Jullien, B., & Klimenko, M. (2021). Language, internet and platform competition. Journal of International Economics, 131. 103439.
[https://doi.org/10.1016/j.jinteco.2021.103439]
- Katz, M. L., & Shapiro, C. (1985). Network externalities, competition, and compatibility. The American Economic Review, 75(3), 424–440.
-
Katz, M. L., & Shapiro, C. (1994). Systems competition and network effects. Journal of Economic Perspectives, 8(2), 93–115.
[https://doi.org/10.1257/jep.8.2.93]
-
Kim, K., & Tse, E. T. S. (2012). Dynamic search engine competition with a knowledge-sharing service. Decision Support Systems, 52(2), 427–437.
[https://doi.org/10.1016/j.dss.2011.10.002]
-
Kim, K., & Tse, E. T. S. (2014). Search engine competition with a knowledge-sharing service. Decision Support Systems, 66, 180–195.
[https://doi.org/10.1016/j.dss.2014.07.002]
-
Lewandowski, D. (2023). Understanding search engines. Springer.
[https://doi.org/10.1007/978-3-031-22789-9]
-
Lianos, I., & Motchenkova, E. (2013). Market dominance and search quality in the search engine market. Journal of Competition Law & Economics, 9(2), 419–455.
[https://doi.org/10.1093/joclec/nhs037]
-
Lieberman, M. B., & Montgomery, D. B. (1988). First-mover advantages. Strategic Management Journal, 9(S1), 41–58.
[https://doi.org/10.1002/smj.4250090706]
-
Oaxaca, R. (1973). Male-female wage differentials in urban labor markets. International Economic Review, 14(3), 693–709.
[https://doi.org/10.2307/2525981]
-
Prüfer, J., & Schottmüller, C. (2021). Competing with big data. The Journal of Industrial Economics, 69(4), 967–1008.
[https://doi.org/10.1111/joie.12259]
-
Rochet, J.-C., & Tirole, J. (2003). Platform competition in two-sided markets. Journal of the European Economic Association, 1(4), 990–1029.
[https://doi.org/10.1162/154247603322493212]
- Shapiro, C., & Varian, H. R. (1999). Information rules: A strategic guide to the network economy. Harvard Business School Press.
- StatCounter. (2026). Search engine market share: Republic of Korea [Data set]. StatCounter Global Stats. https://gs.statcounter.com
-
Taneja, H. (2017). Mapping an audience-centric World Wide Web: A departure from hyperlink analysis. New Media & Society, 19(9), 1331–1348.
[https://doi.org/10.1177/1461444816642172]
-
Webster, J. G., & Ksiazek, T. B. (2012). The dynamics of audience fragmentation: Public attention in an age of digital media. Journal of Communication, 62(1), 39–56.
[https://doi.org/10.1111/j.1460-2466.2011.01616.x]
Appendix
Appendix A. Construction and validation of the behavioural series
The behavioural measurement enters the analysis through two channels with different reliability. Point levels are taken from Internet Trend’s published summary, which reports period-average engine shares directly; these levels underpin every bias figure in Tables 2 and 3 and involve no reconstruction. The monthly behavioural series, used for trajectories and for the rank and correlation statistics, was reconstructed from the provider’s monthly line charts, which display two engines at a time and offer no numeric export. The charts were viewed in the provider’s report interface for January 2015 to June 2026 (all categories, monthly), with NAVER held as the reference series in every view so that the vertical axis was identical across engines. For each engine, values were read against the printed vertical axis at visually identifiable inflection points—peaks, troughs and changes of slope—yielding 16 anchor points for Naver, 16 for Google and 15 for Daum, and the series was linearly interpolated between anchors to monthly resolution. The reconstruction reproduces the level, trajectory, peaks and troughs of each series to within about one to two percentage points at the anchor points. Because it is piecewise-linear between anchors, it smooths single-month extremes; in particular, the November 2020 spike shown on the provider’s chart (Naver 36.2 percent, Google 54.6 percent) is not reproduced; the monthly series is therefore used for trajectories, rank and correlation statistics, but not for the reported bias levels. The anchor-point file, the interpolation script, the reconstructed series and the full analysis code are deposited in a public repository (see Data Availability Statement).
Two checks bound the effect of the reconstruction error on the conclusions. First, the rank-disagreement result is insensitive to perturbations of the size the reconstruction could plausibly introduce. Adding independent noise drawn uniformly from ±2 percentage points to both sources in each month, repeated over 500 draws, leaves the rank-disagreement rate between 89.9 and 94.2 percent, with a mean of 92.1 percent (Table A.1). An adversarial perturbation that moves both sources in the direction most likely to erase the disagreement—lowering the panel’s reading of Naver and raising the referral reading of Naver by two points each—still leaves disagreement at 90.6 percent. Second, the reconstruction tolerance of one to two percentage points is small relative to the 36-point gap between the two sources, so the level conclusions, which rest on the published summary rather than the reconstructed series, do not depend on it.
Rank-disagreement rate under perturbation of both sources.
Seungyong Shin is an Associate Research Fellow at the Science and Technology Policy Institute (STEPI), Republic of Korea. He holds a master's degree and a PhD in Management of Technology (MOT) from Hanyang University. He gained approximately five years of software development experience at Samsung Techwin (now Hanwha Aerospace) and subsequently managed strategic planning and support programs for the ICT startup ecosystem at the National IT Industry Promotion Agency (NIPA). At STEPI, he evaluates government-funded R&D programs and has served as a project manager for preliminary feasibility studies of such programs, overseeing the identification of key issues and the development of policy alternatives. His research interests include technology entrepreneurship, startup ecosystems, startup investment ecosystems (including accelerators and venture capital), and the effectiveness of government-funded R&D programs. Combining practical experience with empirical analysis, he conducts policy research to advance science- and technology-based startup ecosystems and improve the effectiveness of public R&D investment.
Hyunkeun Bae received his PhD in Industrial and Systems Engineering from the Graduate Program in Technology and Innovation Management at Yonsei University in 2026 and his MS in Transportation Engineering from Korea University in 2019. His main research areas include spatial and network analysis, transportation and logistics optimization, economic evaluation, and science and technology policy analysis. His recent empirical research focuses on digital platform markets, government R&D budgets, inter-regional mobility networks, and regional innovation. He joined the Science and Technology Policy Institute (STEPI) in 2020 and is currently a Senior Researcher at the Center for Public R&D Program Evaluation, where he conducts preliminary feasibility studies and performance evaluations of national R&D programs. Since July 2026, he has been seconded to the Policy and Planning Team of the National Economic Advisory Council as a Research Officer, supporting policy planning and advisory work on economic and science, technology, and innovation policy.